CSPlot Manual
 Status:
This information applies to CSPlot version 1.48.962.285 (23. August 2025)
All logged parameters at ISA are now logged by CsLog2020.
1.48.962.285 (23. August 2025): New file format. Files stored with this version can not be loaded with previous versions. Added writing to two different web servers in Auto Export.
From version 1.47.513.268 (17. August 2023):
CsPlot file format has changed, setup files stored with this version can not be opened by previous versions of CsPlot.
From version 1.46.448.267:Series highligthing key operation has changed.
From version 1.47.513.268:
Remark: The CsPlot file format has been extended to include toolbar setup configuration.
Scope mode (for display of K100 data, CConSysGenBlock).
Toolbar/control bars optional saved with file and optional seperated into smaller toolbars.
 Contents:
- Overview
- Parameter Window
- Command line options
- Toolbar commands
- Toolbar state configuration
- Log histories
- x Axis Time Span Dialog
- History Options Dialog
- Plot series highlighting/accelerator keys
- Zooming on plots
- Database configurations related to CsPlot
- Scope Mode
Other links:
- History types
- String format specifications
- Consys home page
- ConSys User Manuals
- CsLog2020 Log database
 Overview
General-purpose plot program for ConSys. The program is based on the TeeChart ActiveX control.
Parameter Window
Parameter windows is used to display a single data source parameter as a text in a window. The window text and background colour can be fixed or changed dependend on the value itself or another data source value. A header line can be added - optional with two different strings dependend on the current colour range.
Name: The window title name.
Data source id: Data source number. If negative (-1) no data value is displayd. Can be used in the case where only the text header display is whanted.
Abs. value before update: The amount the value should change before a new value is painted. Set this value to avoid to much flickering.
Format string: The format string used to when displaying the value. Remark that WORD and boolean parameters are threated as floating points in CsPlot.
Header, Header2: If not empty this header or header2 is displayd above the data value. 'Header' is displayed if 'Colour source id' negative or the the value of parameter selected by 'Colour source id' is below the value specified by 'Header2 from range'. 'Header2' is display when the value of the 'Colour source id' parameter is greather than or equal to the specified range.
Header2 from range: The range from which 'header2' is displayed.
Colour source id: The source paramter id of the data value used to select text and background colour and header string. If the value is negative (-1) colours and headers are not changed.
Flash from range: Flash colours from this range. If this value is greather than or equal to zero and the colour range is activated, the colours will flash at 1 Hz between the current range colours and the following colours. Intended to be used as the last range only, so the text/background will flash only at the last range. But can be used from ant range.
Text/Background colour, limit(n): The text/background colour used when the value of 'Colour source id' is less than or equal to range limit. If only part of the ranges are going to be used (for boolean parameters, or only two or a few colour steps), set the following limit values to the same (or less) as the last used limit value.
Range check descending: Use descending values instead of increasing values in the range check.
Marked values Special version of parameter window used to show marked values.
Show marked values: If enabled, the display shows a list of marked values only.
Show time: If enabled, include time.
Number of values: Number of values in the list.
Command line start options:
csplot <filename>:
Starts csplot with the specified configuration file, ex.
csplot \\isasvr14\isadfs\Nat_ISA-Astrid2\setups\CsPlot\A2-beamcurrent.csp
csplot /p <parameter 1> <parameter 2> ....
start csplot, and make individual plot windows for each parameter specified in the plot. If only one parameter is specified, the plot window is maximised. The plots start activated.
csplot /s <parameter 1> <parameter 2> ....
Like /p, but with all parameters displayed in a single plot window. Parameters started with /p will also plot in this window. If less than 5 parameters are specified, parameters logged with averaging will be plotted as average, min, max - otherwise only as average values.
csplot /dsn=<Log Database>
csplot /dsn <Log Database>
ConSys histories using original ConSys SQL log database. CSPlot can obtain data from the ConSys SQL Log database logged with the Datalogger. When this option is specified, CSPlot will get the logged data from the specified ODBC database. If not specified, CsPlot will use CsLog2020 histories.
csplot /ldb <ODBC Name CsLog2020 database>
Set this option to specify a specific CsLog2020 ODBC database. Without this option CsPlot will get logged data from the ODBC log database specified by the ConSys configuration database. With /ldp set, all log data will be from the specified database. Typical used for development to access log data in a test log database.
csplot /pos (<x>,<y>,<width>,<height>)
Start CsPlot at the given position and size. Remark that the current plot window position of a running CsPlot application can be obtained from the CsPlot menu command 'Window|Get Window Position'
Ex: csplot /pos (100,200,1000,2000)
csplot /n
csplot /nowarning
Disable history invalid type warnings
csplot /da
Start with SQL history log auto update disabled (for ConSys log 2020). Default is enabled. Before version 1.45.386.254, the option /a enabled this feature.
csplot /x
Disable hardcoded scale zoom enable defaults and startup with x-axis zoom enabled
csplot /y
Disable hardcoded scale zoom enable defaults and startup with left and right y-axis zoom enabled
csplot /yl
Disable hardcoded scale zoom enable defaults and startup with left y-axis zoom enabled
csplot /yr
Disable hardcoded scale zoom enable defaults and startup with right y-axis zoom enabled
csplot /e
Activate forced enabled - forced overwrite of loaded file(s) default autostart/enable
csplot /d
Activate forced disabled - forced overwrite of loaded file(s) default autostart/enable
csplot /c
csplot /cslog2020
Start up with csLog2020 history instead of live history.
Disabled 28. May 2024, 1.47.752.274: If zoom options not set by other command line options before this directive, also checks x scale zoom and resets y-scale zoom on both axis
csplot /m <filter>
csplot /mark <filter>
Set startup CsLog2020 log database mark filters.
Toolbar Commands

 New CsPlot document.
 Open CsPlot file.
 Open 2: Same as Open, but with seperate path storage.
 Save CsPlot document.
 Export plot data to text file.
 Reconnect. Close ConSys connection and reconnect with full history.
 Refresh plot. Replots all data.
 Activate/Deactivate plot status and control. Same as Activate in plot control window.
![]() Clear live data. Delete live data histories and deactivate ConSys connection. Used with SQL history data to get history data only.
Clear live data. Delete live data histories and deactivate ConSys connection. Used with SQL history data to get history data only.
 Pause live data - status and control. Temporary pause ConSys live data. Automatic restarted.
 Reset plot window scale. If used in the control window all plot windows belonging to the the same document as the control window will have their scale restored.
 Get Full SQL Log History. Disable and clear live data. Expands x-scale to full with of the oldest SQL history and gets SQL data.
 Log history auto update enable/disable. Only present when ConSysLog2020 database is connected. When enabled, SQL history data will be updated a short time after the last change of the x-scale.
 Log history update. Gets history data from the log database for the missing regions in the current range in the active window. Maximum number of points pr. update is limited to the number set in the configuration.
 Expand x-scale and get history data for the expanded range.
 History show/hide - status and control.
 Delete all internal history data buffers.
 History options. Opens the History Options Dialog.
 Opens the x Axis Time Span Dialog. Usefull together with the log history 2020 version enabled.
 Move the plot data left.
 Move the plot data right.
 Double x-scale range. Double centered around mid of plot if posible. If upper (current time) or lower (oldest history point) 'hit' the
expand center point is adjusted to optimize the plot range.
Double x-scale range. Double centered around mid of plot if posible. If upper (current time) or lower (oldest history point) 'hit' the
expand center point is adjusted to optimize the plot range.
 Half x-range around center of the current x-axis.
 Full x-scale - adjust the x-scale to make all live ConSys data visible.
 Auto-scale left y-scale enable/disable. When enabled, the y-scale is in adjusted to show all values for series using the left y-scale.
 Auto-scale right y-scale enable/disable. When enabled, the y-scale is in adjusted to show all values for series using the right y-scale.
 Increase the Y-axis by 2% enable/disable. Used with autoscale active to avoid plotting max and min values on the plot window frame.
 Enable/disable a plot series highligting. Change between series using arrow up/down keys. Live data and corresponding history data series are hightlighted together.
 Enable/disable zoom on the x-axis. When enabled the x-axis will be updated to the selecting range when a zoom range is selected the mouse in the active window.
 Enable/disable zoom on the left y-axis. -- '' --
 Enable/disable zoom on the right y-axis. -- '' --
 Print active window.
 Opens this help page.
Toolbar state configuration
From version 1.47.513.268:
The original toolbar described above has been split into 5 separate toolbars. The split toolbars can be enabled individually by enabling the toolbars in the CsPlot menu under View. By default, CsPlot start up with the original toolbar. The toolbar configuration can be saved to registry and optional in CsPlot setup files. Depending on the type of plot the settings are stored in either a default section for standard plots or scope section for scope plots. When CsPlot is opened it will startup with the original toolbar if the toolbar configuration has not been saved to registry. If the configuration has been saved to registry, the saved configuration is loaded. If a scope setup is loaded and no other setup has been loaded, the saved scope toolbar configuration from registry will be loaded. The toolbar configuration can also be stored with a setup file. If a toolbar configuration is saved with a setup file the toolbar configuration saved with the setup file will be set if and only if the setup file is the first setup file opened.
Commands, in plot menu|view
Save Startup Control Bar State: Save the control bar settings in registry. Saved on default section for standard plots and scope section for scope setup.
Load default control bar settings : Load default control bar settings saved in registry by 'Save control bar settings'.
Load scope control bar settings: Load scope control bar settings saved in registry by 'Save control bar settings' in scope mode.
Set Bar State to document:Set the current bar state to document. When the bar state has been set to a document, the bar state will be set when the plot file is loaded if first file loaded in CsPlot.
Clear document stored bar state: Remove the use of stored bar state from the document
Example of toolbar settings (stored in setup file):
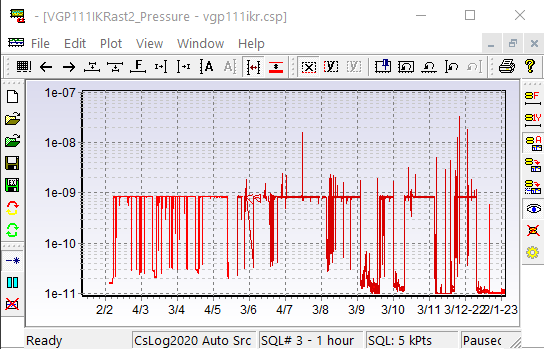
SQL log database History
CsPlot can obtain history data from the SQL log databases. From version 1.42.110.246 (10. sep 2020) CsPlot support both the original ConSys log database and the new SQL Log database 2020. The log history source to use can be specified at startup - see Command line options. If the plot source is not specified by a startup command line, CsPlot will bring up a dialog to select an ODBC log history source when a history update is selected. When the log database is selected at runtime, CsPlot will check the ODBC/SQL source and detect the history type (orginal/2020) from the log database selected.
Original ConSys log source format
Log data logged with the ConSys Datalogger program. The log data is stored in one table - with a unique log id for each logging. ConSys paramters are typical logged with a single log id, but can be under several ids. If a parameter is logged with more under more than one log id the log ids must be specified with when specifying the data source.
Log Ids: See History from https://www.isa.au.dk/CSData/StartPage.asp
2020 SQL ConSys log format
The 2020 SQL ConSys log use a single table for each ConSys parameter. Each logging contains a timestamp, a data value and a byte with a log filter. History Options Dialog
x Axis Time Span Dialog
The X axis time span dialog is used to set/update the x-axis of the current window. When the dialog is opened, it starts up with the current x-scale of the calling window. If the calling plot window is paused on open, the x-axis scale dialog starts up with 'Time span mode' set to 'From-To' in paused state. Otherwise, the dialog start up in 'Time span mode' set to '<CurTime-TimeSpan> - <CurTm>' - without being in paused state. The dialog will keep the unpaused state until another operation time span mode is selected. When first in paused state the dialog/plot will stay in paused state.
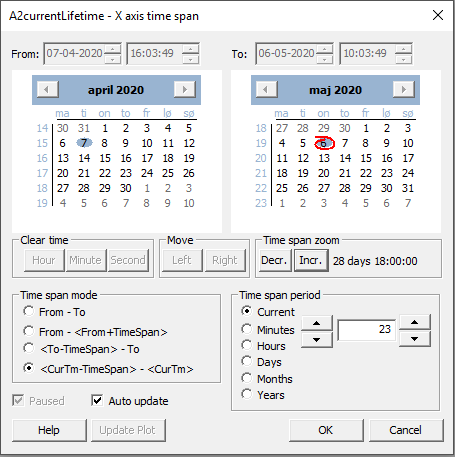
'From','To' selections:
The From/To controls are used to show and select the current start end end time of the plot. The use of the controls depend on the current 'Time span mode' selection. Only the From/To controls that can be changed in a given operation mode are active. Date and year can be selected either on the year edit boxes or in the calender controls. The time can be set by the time edit controls. Time and dates are updated by other controls in the dialog.
'Clear time' group:
The clear time buttons work together with the From/To controls. Dependend on the current 'Time span mode', either the from, to or both time settings will be zeroed. The time span set by zeroing can not be less than 5 seconds.
Second: Set seconds to zero.
Minute: Set minutes and seconds to zero.
Hour: Set hours, minutes and seconds to zero.
'Move' group:
Move plot left or right. The allowed move range is dependend on the current 'Time span mode'. Keeping the Left/Right keys pressed will continuous move the plot.
Left: Move the plot window time span left.
Right: Move the plot window time span right.
'Time span zoom' group:
The increment/decrement buttons are used to zoom in/out on the x-axis. The current plot period is show next to the 'Decr./Incr.' buttons. The operation of the buttons depend on the current 'Time span mode' - for details see the 'Time span mode' descriptions below. Keeping the Decr/Incr keys pressed will continuous zoom the plot.
To zoom in/out on a particular spot on the x-axis, the 'From-To' 'Time span mode' is often the most usefull. In this mode, the 'Decr./Incr.' zooms around the center of the plot. The 'Incr' method will be disabled before the plot min/max allowed limits are hit - this to avoid having to move the zoom center. Together with the 'Left/Right' controls a specific point on the x-axis can easely be selected and invistigated in this mode.
'Time span mode' group:
Radio button:
- 'From - To': In this mode, the time span is set by the 'From' and 'To' fields in the top of the dialog. The increment/decrement controls in the 'Time span zoom' group zooms around the center of the plot in this mode.
- From - '<From+TimeSpan>': The start of the plot is set by the 'From' controls. The plot period/span is set by the 'Time span period' controls. The increment/decrement controls in the 'Time span zoom' group will keep 'From' fixed and update 'To' in this mode.
- '<To-TimeSpan> - To': The end of the plot is set by the 'To' controls. The plot period/span is set by the 'Time span period' controls. The increment/decrement controls in the 'Time span zoom' group will keep 'To' fixed and update 'From' in this mode.
- '<CurTime-TimeSpan> - <CurTm>':The end of the plot is set by the current time as long as the plot is not paused. If paused, 'To' is set to the time when pause was pressed/the dialog opened. The plot period/span is set by the 'Time span period' controls. The increment/decrement controls in the 'Time span zoom' group will keep 'To' fixed and update 'From' in this mode.
'Time span period' group:
The radio button and spin controls in this group are used to select the plot period for the operation modes that specify a span range.
Radio button:
- 'Current': If selected, the time span used is the one displayd in the 'Time span zoom' group. This selection is automatic selected when the time span is changed due to actions outside the 'Time span period' group. It can not be selected directly.
- 'Minutes',..,'Years': When one of these checks are selected, the plot period is given by the value field in units given by the checked selection. Selecting one of these radio buttons will change the unit without changing the value field. The selection can also be changed by the left spin control - see below for details.
Value edit control: The current period in units of selection if 'Current' is not selcted. New period values can be entered directly or changed by the spin controls.
Left spin control: The left spin control will change the 'time span period' radio button selection up/down and update the period value dependend on current radio button selection. If 'Current' is pressently selected, pressing the 'Down' spin wheel will select the most appropriate time unit and update the period value with a number as close as posible to the current time span period. If a time unit is selected, the up/down controls will change to the prev/next selection and update the period value to the best posible value. Up/Down will only be possible for some period values.
Right spin control: Used to increment/decrement period value. Keeping the up/down spincontrols pressed will continuous increment/decrement the period value.
Other controls:
Update plot: Update plot window with the current from - to settings in the dialog.
Paused: Show paused status. When once in pasued state the dialog will stay in paused state. The dialog can only be in unpaused state if the dialog was openened when the owning window was in unpaused state. The state will change to paused state if 'Time span mode' is set to anything else than '<CurTime-TimeSpan> - <CurTm>' . Remark: The owning plot window control will not show the paused state change.
Auto update: If selected, the plot window is updated everytime from, to is changed by the dialog controls.
History Options Dialog
The Database History options dialog controls how SQL histories are displayed and updated. The 'Plot Method' and 'Database access' section settings are common for the original ConSys SQL log data and CsLog2020 log data. The 'Filter (Marks)' sections is only used with the CsLog2020 log database data. The mark byte usage are depends on the log method. For standard loggings, the filter bits in the mark byte and their usage in CsPlot is described in details below.
For parameters logged with one of the average methods the usage of the usage of bit 1-3 (Data Mark Step 1, Data Mak Step 2 and Data End) are different from the standard usage - and the use of these bits in CsPlot DOES NOT depend on the check mark settings in the options dialog). The Period Mark Bits (The radio button selections in th 'Filter (Marks)' settings are however taken into account by CsPlot - selecting the lowest period of data available in the backup loggings.
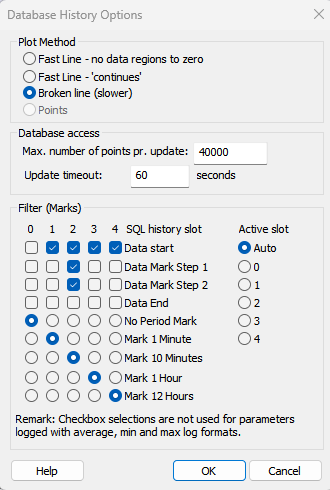
'Plot Method' group:
Fast Line - no data regions to zero: Plot histories as a single curve/series - regions without data will be plotted as 0.
Fast Line - 'continues': Plot histories as a single curve/series - regions without data be connected with a line between end/start points of each history section.
Broken line (slower): Histories will be plotted with no values/lines in sections without history data.
'Database access' group:
Max. number of points pr. update:The maximum numbe of points retrived from each SQL request.
Update timeout:Time time to wait for a responce from the SQL log database.
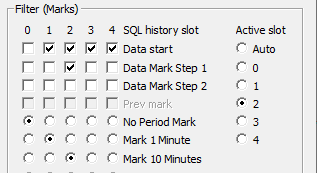
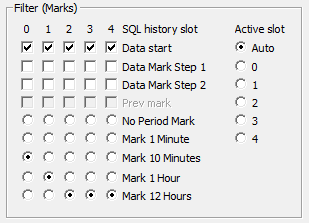
'Filter (Marks)' group:
This section of the history options is only available for the 2020 SQL history log format. For this history log type CsPlot has 5 'SQL history slots' (0..4). Each slot has its own buffer in CsPlot and a set of filters that define which data are retrieved from the SQL log database. Each logged value in the SQL 2020 database is logged with a time and a filter byte. When retrieving the logged history only values fulfilling the active filter settings will be included. If one of the filter bits are set in the database filter, the value is included - ie. filters are selected with a binary OR between all bits in the filter byte.
The filter bits in the mark byte are:
The 4 least significant bits are used for special marks, the four most significant bits for time marks. The least 4 signicant use is device/and or log method specific.
Bit 0, the data start mark, is common for all. Bit 1-3 vary, the default use as below:
bit 0, 0x01: Start, Set at every start of a log series (device/DataLogger start)
bit 1, 0x02: Event mark 1, Set by device/application, default absolute change greather than 10%
bit 2, 0x04: Event mark 2, Set by device/application
bit 3, 0x08: End
bit 4, 0x10: 1 minute mark, Set by core log code when at least one minute since last 1 minute mark.
bit 5, 0x20: 10 minute mark, Set by core log code when at least 10 minutes since last 10 minute mark.
bit 6, 0x40: 1 hour mark, Set by core log code when at least 1 hour since last 1 hour mark.
bit 7, 0x80: 12 hour mark, Set by core log code when at least 12 hours since last 12 hour mark.
Mark byte for averaged loggings:
Bits not mentioned below is used as above. Depending on min/max/average mode of average logging (log mode), the bit 1-3 usage marks the kind of value. Remark
that for average/min/max values only the time mark bit corresponding to the average period is set:
bit 0, 0x01: Start, Set at every start of a log series (device/DataLogger start)
bit 1, 0x02: Minimum mark, Set by average logging on logged minimum values.
bit 2, 0x04: Maximum mark, Set by average logging on logged maximum values.
bit 3, 0x08: Average mark, Set by average logging on logged averaged values.
bit 4, 0x10: 1 minute mark, Set on values belonging to a 1 minute average period.
bit 5, 0x20: 10 minute mark, Set on values belonging to a 10 minute average period.
bit 6, 0x40: 1 hour mark, Set on values belonging to a 1 hour average period.
bit 7, 0x80: 12 hour mark, Set on values belonging to 12 hours average period.
Active slot:
Selection of SQL history slot to use for the history plots.
Auto: The slot to use is calculated in CsPlot from the plot timespan. CsPlot will select the first slot that has the most apropriate mark period selection for the given timespan.
0..4: Use the selected slot filter set.
Examples:
Default configuration:
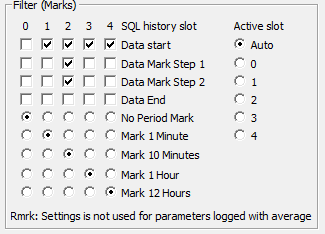
The default configuration use all available time slots. The 'Active slot' is set to 'Auto' to let CsPlot decide which slot to use from the current x-axis time span. For 'No Period Mark', no other filters are selected (makes no difference as all log points are already included. From 'Mark 1 Minute' to 'Mark 12 Hours' the 'Data start' marks are checked by default. This ensures that all data start marks are included in the dataset obtained from the database. For 'Mark 10 Minutes' 'Data Mark Step 1' is included as well. This means that the log set 2 includes a point for every 10 minutes plus points with 'Data start marks' or 'Data mark step 1' set as well.
Fixed 10 Minutes intervals between history values:
In this example CsPlot use the fixed history slot 2 where the point's retrieved from the database has at least one 'Data Start','Data Mark 1' or 'Mark 10 minutes' set.
Use at 10 Minutes intervals between history values:
In this example only 10 minute and longer intervals are used in the slot selection. All selections include points with 'Data start' mark set.
History information in the status bar:
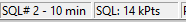
The CsPlot status bar shows the selected slot (2) and the Mark period in the selected slot (10 min). The status bar also shows the total number of cached SQL data points for summed overall data slots. (14 kPts).
Plot series highlighting/accelerator keys
One plot series at a time can highlighted (made 3 pixels wider than the defined plot width) by using keyboard accelerators. If SQL history data is present for a live plot series, the related SQL data series is highlighted together with the live data plot series. The accelerator keys to highlight plot series are:
<Up arrow>: Select the next plot series for highlighting (and turn on series highlighting if no series was highlighted)
<Down arrow>: Select the previous plot series for highlighting (and turn on series highlighting if no series was highlighted)
<Left arrow>: Toggle series highlighting on/off. When set on, reset series index to first series.
<Right arrow>: Toggle show labels on values for highlighted series (off, values, timestamps)
<Space>: Toggle hide all other series (hide/unhide)
For parameters logged with average, min and max values tree plot series are plotted for each data series (average, minimum and maximum). The methods above highlights the logged average data together with the live data series. To highlight the minimum and maximum series, first used the method above using the arrow keys to select the plot data source to highlight. The use the methods below to highlight min, max and averaged values for the data series selected with the arrow keys:
Keys common for all logged parameters:
0: Turn highlight series off1: Highlight live data and history (avg history if present in avg, min max, otherwise min or max as selected.)
2: Highlight live data
3: Highlight history data (avg history if present in avg, min max, otherwise min or max as selected.)
Additional keys For parameters logged with average, min and max:
4: Highlight minimum series5: Highlight maximum series
+: Toggle between 0-3(5)
Other accelerator keys:
S: Toggle show SQL average history data with live data.X: Set the x scale range.
L: Move Left - x-scale.
R: Move Right - x-scale.
F: Get Full SQL Log History. Disable and clear live data for all plot windows. Expands x-scale to full width of the oldest SQL history and gets SQL data.
Y: Show data for the last year - does not change status of live data - i.e. keeps live data if enabled. Pause plot..
A: Get SQL history data for additional time.
Zooming on plots
Increase and Decrease Y-scale: Zoom on both left and right axis or only left or right. Dependend on check of 'Enable left zoom' and 'Enable right zoom' and autoscale left/right
| Enable Zoom Left | Enable Zoom Right | Incr/Decr Left | Incr/Decr Right |
| Unchecked | Unchecked | Enabled if not autoscale left | Enabled if not autoscale right |
| Unchecked | Checked | Disabled | Enabled if not autoscale right |
| Checked | Unchecked | Enabled if not autoscale left | Disabled |
| Checked | Checked | Enabled if not autoscale left | Enabled if not autoscale right |
Database configurations related to CsPlot
Interpretation
D2: Lower limit.
D3: Upper limit.
I13: chartType: Used by CsPlot:
undefined, and all other values than below: Standard chart.
1000: Expontial/Vacuum chart.
D2 and D3 is used as initial lower and upper plot limit for the chart y-axis.
Scope Mode
From version 1.47.513.268:
CsPlot can plot array data in a scope like display. For the moment CsPlot only support K100 digitizer data received as ConSysGenBlock data. The design of the code is made to be able to support other scope like data if needed but this will need some additions to the code for the specific datatypes. To setup a scope plot, define Data Source as a parameter of type K100 CConSysGenBlockData - with type set to '4: Data block contains K100 digitizer waveform'. These parameters are 'K100DIGIXmic.digitizerACust', where X is 1..4. To show the scope source parameters in a scope plot, create a Scope Window and and scope data source to the plot. The K100 data can also be added to a Parameter Window in shich case the K100 timestamp for latest received data block is displayd as text.
When Scope data sources are defined CsPlot sets itself in 'Scope' mode. In this mode, the scope toolbar can be enabled - and the scope toolbar registry storage is used instead of the standard storage if toolbar positions are stored - see Toolbar state configuration
 Set current trace as reference trace.
 Start collecting multitrace data. When enabled will store and display
the next 100 scope arrays for each data set.
Start collecting multitrace data. When enabled will store and display
the next 100 scope arrays for each data set.
 Starts collecting multitrace data. 4 buffers of each 25 traces are stored/displayed for each data source.
when a buffer is full, the oldest buffer is cleared and used for the next data received - ie. the scope data will show between 75-100 traces.
Starts collecting multitrace data. 4 buffers of each 25 traces are stored/displayed for each data source.
when a buffer is full, the oldest buffer is cleared and used for the next data received - ie. the scope data will show between 75-100 traces.
![]() Clear multitrace data buffers.
Clear multitrace data buffers.
Last Update: 6. january 2023
Last Modified 03 October 2025